Super Store Sales Analytics Final Year Project Source Code
Get runnable Super Store Sales Analytics Final Year Project Source Code with database files, project setup instructions, live demo options and installation support.
This project resource helps students understand the implementation, modules, workflow and technical architecture of a complete DATA-ANALYTICS project.
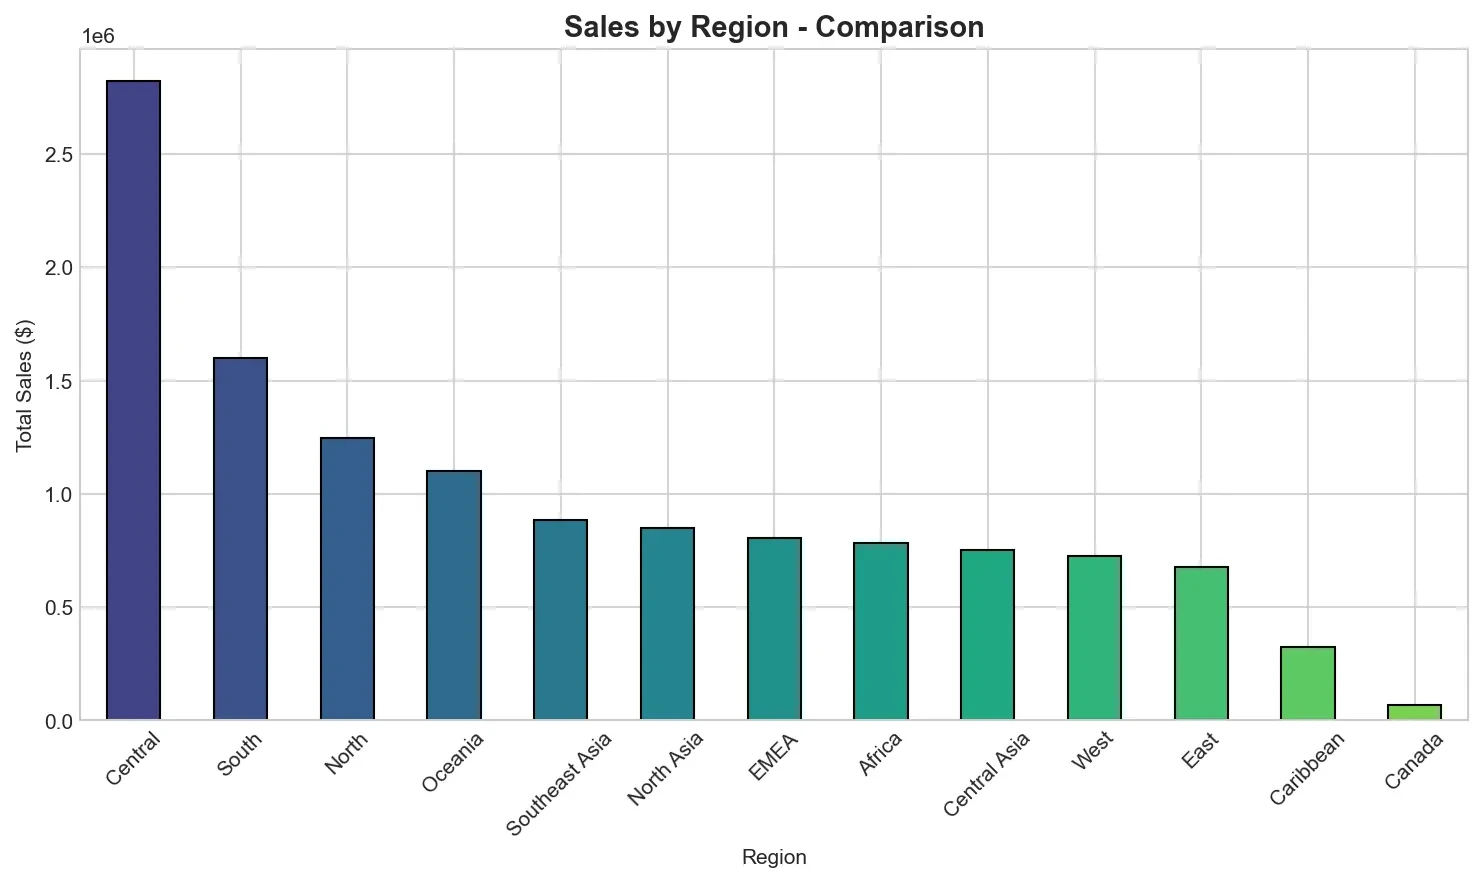
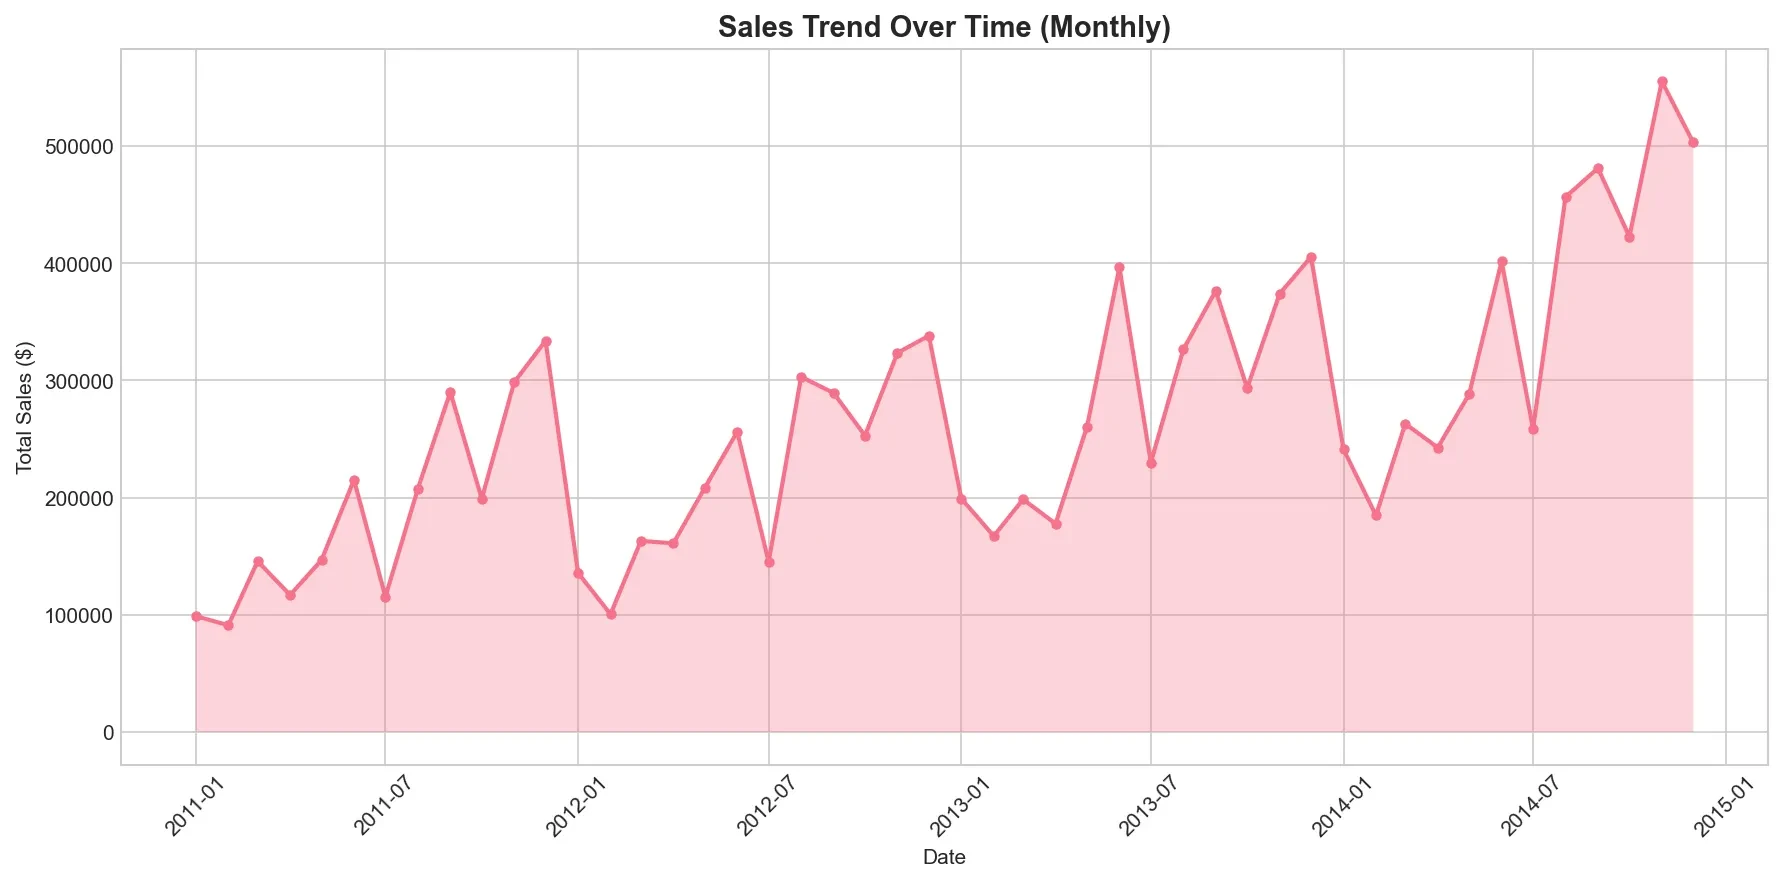
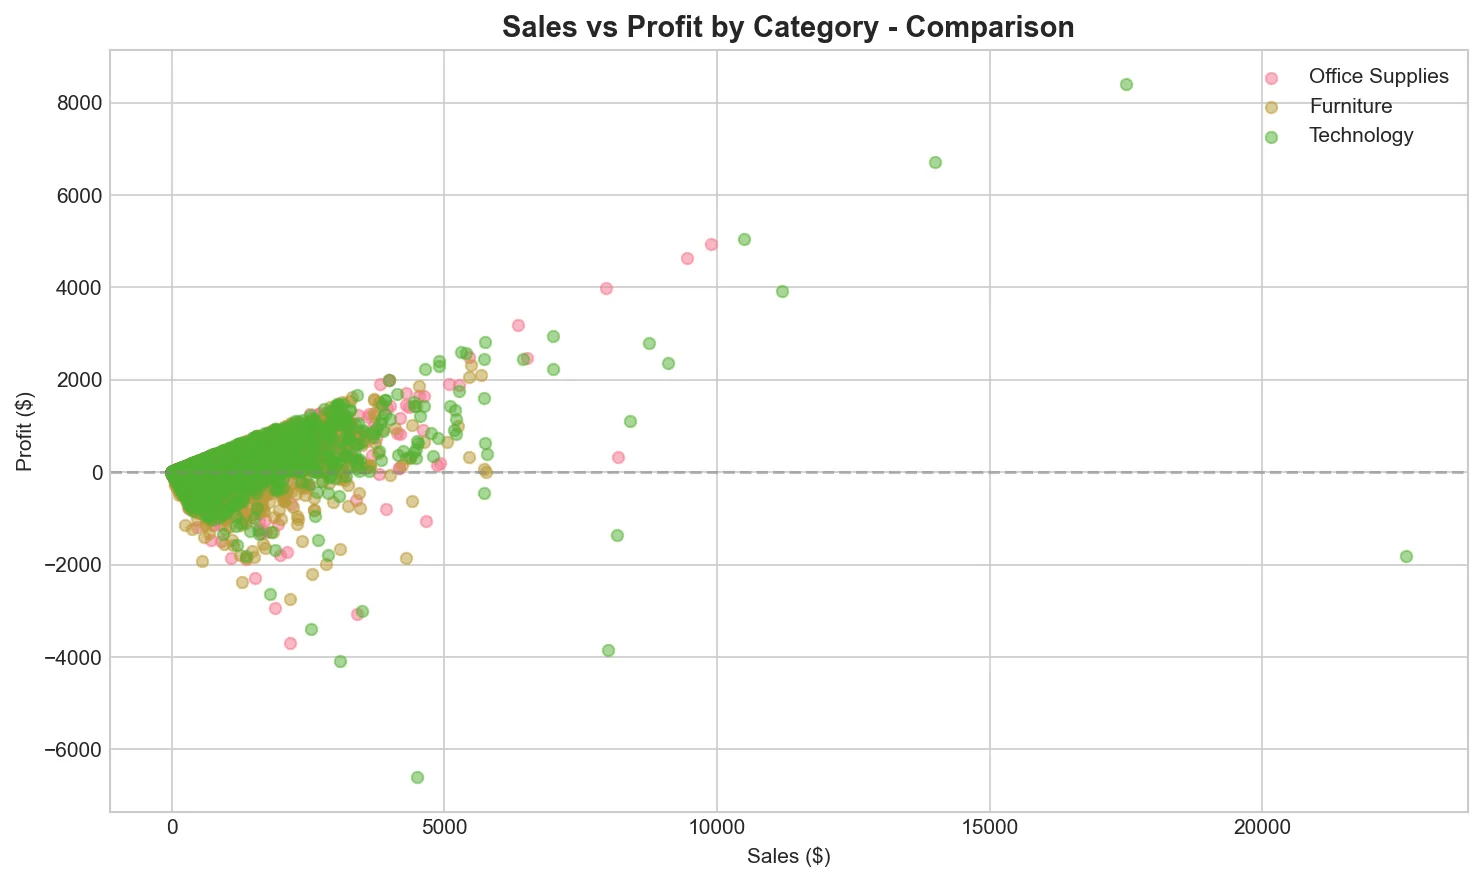
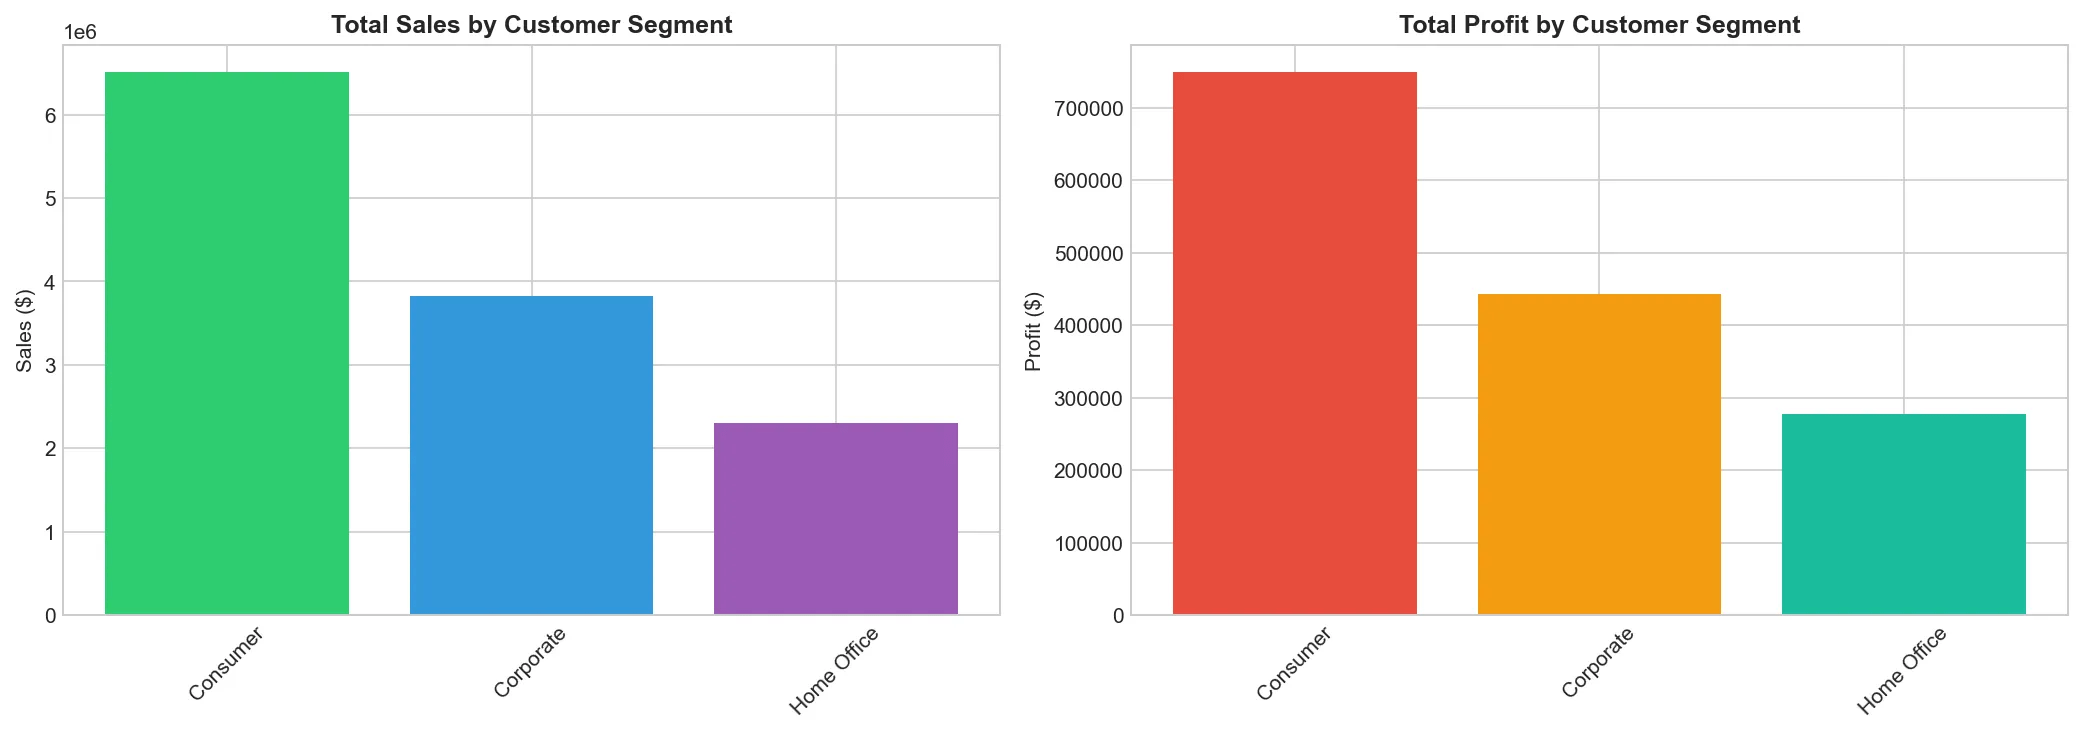
Super Store Sales Analytics is a Python-based final year project developed for analyzing retail sales data and predicting sales using machine learning. This major project uses the Kaggle Superstore Sales dataset to perform exploratory data analysis, statistical summary, missing-value checking, correlation analysis, comparison visualizations, and sales prediction. The project generates multiple graphs such as sales by region, sales by category, monthly sales trend, sales vs profit, segment comparison, top sub-categories, correlation heatmap, and actual vs predicted sales graph. It uses Random Forest and Linear Regression models for sales prediction and evaluates model performance using R², RMSE, and MAE. This Super Store Sales Analytics source code is suitable for students who need a final year project, major project, minor project, source code, and project report based on Python, data analytics, retail analytics, visualization, and machine learning
Login Credentials
This project has no login credentials because it is not a web application.
Credential note:
No admin panel, user login, password, or database authentication is included. The project runs locally as a Python data analysis and machine learning script
Prediction Sales Graph
File: 8_prediction_sales_graph.png
Chart type: Actual vs predicted graph
Shows comparison between actual sales and predicted sales.
Machine Learning Features in this Final Year Project
Sales prediction using machine learning
Uses Random Forest model
Uses Linear Regression model
Predicts sales from available retail dataset features
Performs train-test split
Trains regression models
Compares actual and predicted sales
Evaluates models using:
R² score
RMSE
MAE
Prints model metrics in console
Generates prediction sales graph
Useful for sales forecasting and business analytics demonstration
Dataset Details in this Final Year Project
Dataset:
Kaggle Superstore Sales dataset
Dataset source options:
Kaggle CLI download
Manual Kaggle CSV download
Auto-generated sample data if no dataset is found
Dataset folder:
data/
Common Superstore fields may include:
Order date
Ship date
Region
Category
Sub-category
Segment
Sales
Profit
Discount
Quantity
State
City
Product details
Files / Modules Included in this Final Year Project
superstore_sales_analytics.py — main analysis and ML script
download_dataset.py — Kaggle dataset downloader
requirements.txt — Python dependency list
README.md — project documentation
data/ — dataset folder
output/graphs/ — generated visualization folder
Output Files in this Final Year Project
The project generates output graphs inside:
output/graphs/
Expected output files:
1_sales_by_region.png
2_sales_by_category.png
3_sales_trend_over_time.png
4_sales_vs_profit.png
5_segment_comparison.png
6_top_subcategories.png
7_correlation_heatmap.png
8_prediction_sales_graph.png
Console output includes:
EDA summary
Missing-value analysis
Correlation details
Model R² score
RMSE value
MAE value
Open terminal in the project folder:
cd "superstore-sales-prediction-data-analysis"
Install dependencies:
pip install -r requirements.txt
Optional: download dataset using Kaggle CLI:
python download_dataset.py
Or manually download a Superstore CSV dataset and place it in:
data/
Run the project:
python superstore_sales_analytics.py
Check generated graphs:
output/graphs/
README Included
Setup Support Available
This project has no login credentials because it is not a web application.
Credential note:
No admin panel, user login, password, or database authentication is included. The project runs locally as a Python data analysis and machine learning script
Exclusive offer
Wait! Save ₹10 Before You Leave
Wait! Get 10% Extra Off
Complete your order now and save an extra 10%.
Your project is ready. Apply FM10 and complete your order at a lower price.